
While my research has generally revolved around understanding astronomical systems named Ultraluminous X-ray sources, recently I took a stab at algorithm development. This came about after realizing the existing methods to detect periodicities in time series with irregular cadence were not apt for the data I had at hand. I was investigating the recently discovered ‘superorbital’ periods in Ultraluminous X-ray sources. On the one hand I wanted to understand what was creating or causing these periodicities, while on the other hand I was trying to detect more of them, as we had only detected these signals in small number of systems (about a handful so far). But ‘detecting’ periodicities in this data turned out to be a challenge.
One of the systems I was studying was the abnormally luminous pulsar P13 in the NGC 7793 galaxy, at nearly 13 million light-years.
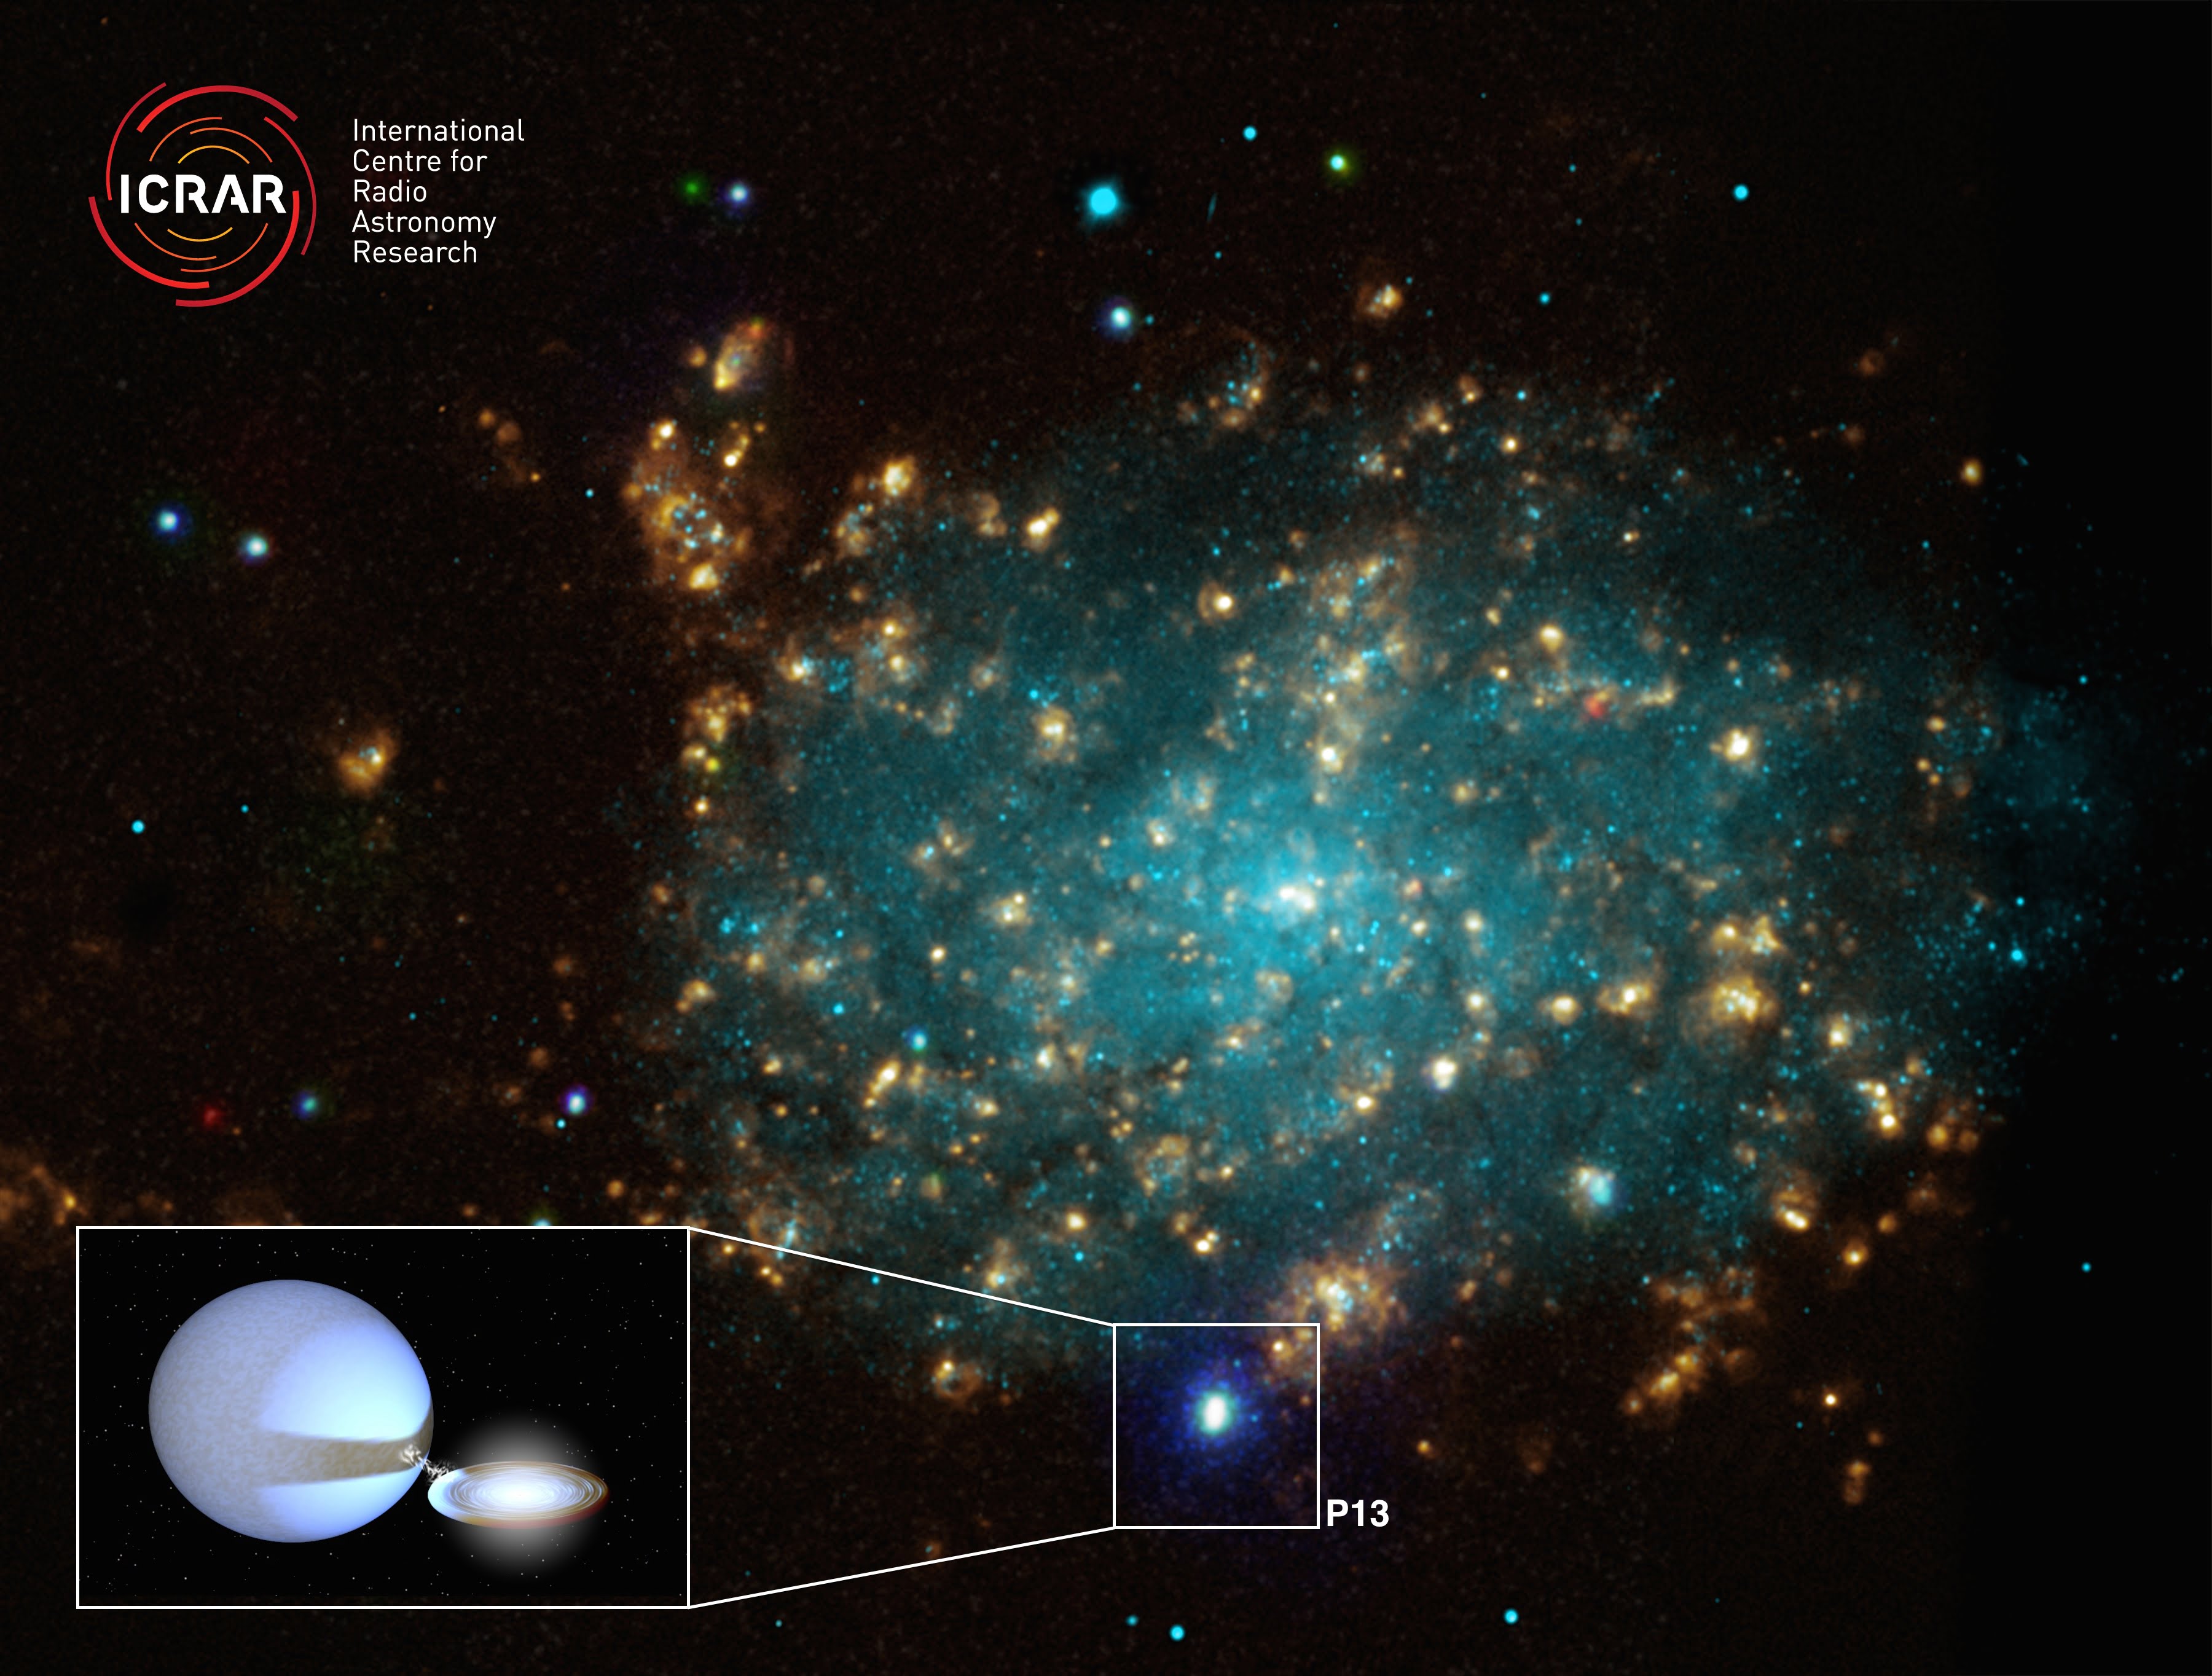
This binary system had been monitored by NASA’s Swift X-ray Telescope. I wanted to determine whether the observed variability in the ‘lightcurve’ — how the amount of received photons from a given system varies over time — of this system was periodic (i.e. repeating in a predictable manner) or ‘random’.
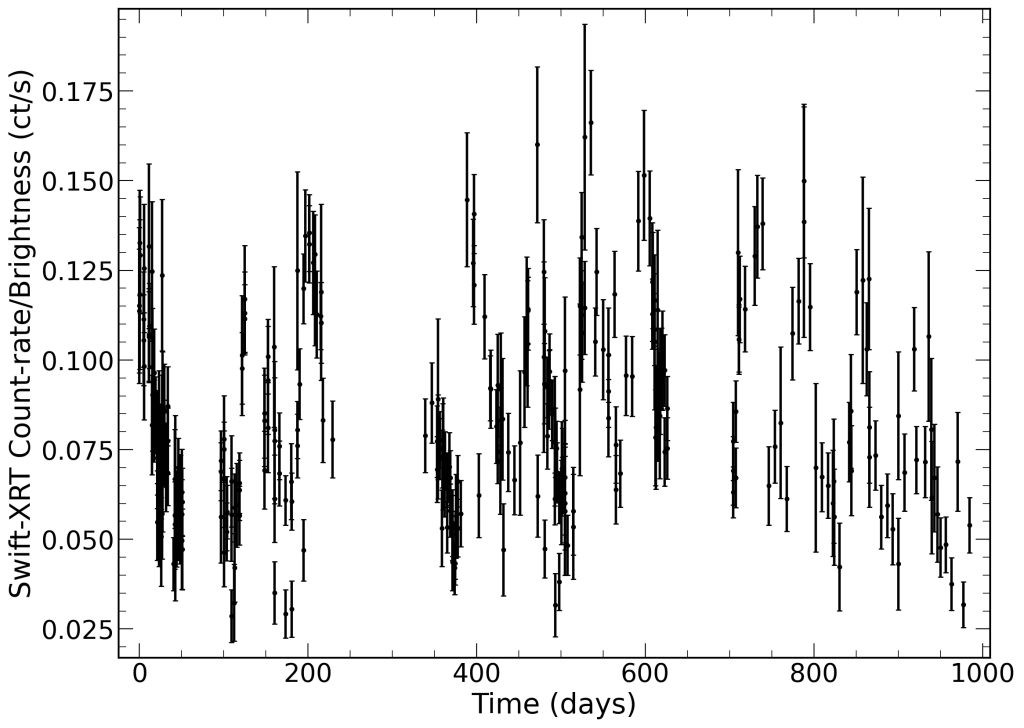
Previous studies had claimed these variations were indeed periodic. The orbital period of the binary system was known through the modulation the companion star imprints on the photons emitted from the neutron star. Hence this newly detected period, which was longer than the known orbital period, had to be ‘superorbital’ — which is just a fancy way to say unknown-periodicity-longer-than-the-orbital period. What causes these superorbital periods remains debated, but they are likely caused by the accretion disc precessing (for badass General Relativistic Magneto-Hydrodynamical simulations of precessing accretion flows around black holes see).
What this lightcurve illustrates are two common problems in astronomy. First is the predominance of interrupted or intermittent observing strategies. Think Moon/Sun occulations, orbital constraints for space observatories or weather patterns, day/night cycles for ground-based observatories. As a result, the cadence is not only irregular, but it also contains gaps between more continuous measurements. The second problem is the presence of intrinsic aperiodic or stochastic variability (i.e. non deterministic), which is universally observed in both accreting systems and stars. To illustrate this, take a look at the mock lightcurve below.
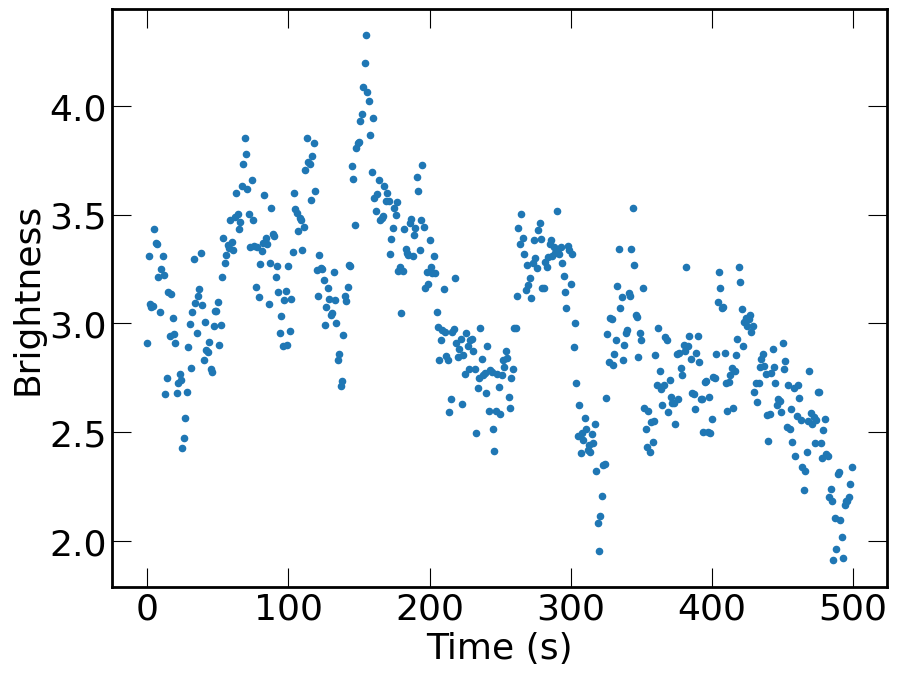
The lightcurve was generated using a famous algorithm in astronomy with no periodic component; the variability you see is purely random or stochastic: it is simply the result of a more sophisticated form of a Random Walk. That is, each datapoint has some degree of correlation with the previous one. In practice, this means it is highly unlikely to find sharp changes in brightness, and instead the difference in brightness between two consecutive datapoints is always relatively smooth (more technically, the difference in brightness between datapoints are Gaussian, so no extreme events occur). This type of variability is no different than that frequently observed in e.g. the stock market when looked at sufficiently long timescales (for instance week or monthly averages).
Now what is remarkable about this lightcurve is that it genuinely looks periodic; one may be tempted to conclude these smooth and seemingly regular increases and decays are periodic, even though no periodicity was injected in its creation. So in astronomy, detecting a periodic pattern (something predictable and deterministic) is better framed as “How certain am I that what I’m looking at does *look* periodic, by chance?” and by chance, we mean given the sampling pattern (more regular and dense or irregular and sparse), measurement uncertainties, and variability of the type of system I am looking at. For instance, a galaxy as a whole is a relatively stable object for human timescales and very unlikely to produce the type of random variability shown above (in fact any variations at all), while accreting systems are instead highly variable and their variability VERY prone to masquerade as periodic (as the above showed).
Such stochastic variability is universally observed in accreting systems and is thought to arise in fluctuations in the accretion disc. The problem is that when the sampling is sparse, this random fluctuations can easily be mistaken for truly periodic variability, making it extremely challenging to identify rare phenomena such as quasi-periodic oscillations in quasars, quasi-periodic pulsations in stars, other exotic systems such as supermassive black hole binaries or as we saw above, superorbital periods in accreting systems.
A tool routinely used to detect periodicities in astronomy (and other fields) is the periodogram, which involves calculating the amplitudes of the Fourier transform — a proxy for ‘amount of variability’ as a function of frequency or timescale. The expectation is that a periodic signal will have a strong variability component at a single frequency (remember how the Fourier transform of a sine function is a delta function). When the sampling is regular, Fourier techniques are well understood and tractable, but when the sampling is irregular, Fourier techniques give raise to a lot of spurious signals, because the sampling pattern gets mixed up with the signal (along with other problems).
What we have developed is a method based on Gaussian Process (GPs) modelling and Monte Carlo simulations specifically developed to overcome problems arising from the sampling pattern and the underlying variability of the system. What makes the method so powerful is that it works on any sampling – interrupted, irregular, continuous – accounts for measurement uncertainties, and, importantly, makes no assumptions about the underlying variability of the system. Instead, we use the observed variability to calibrate our statistical test, to calibrate how surprised we should be, having observed this precise lightcurve under the assumption there is no periodicity. If we find it is very likely to have observed this lightcurve assuming no periodicity, then we conclude there is no periodicity. Instead, if it is very unlikely to have observed this lightcurve under the assumption that there is no periodicity, then we conclude most likely there is a periodic pattern.
A paper detailing the technical details of the method has been published in the Monthly Notices of the Royal Astronomical Society, and a python implementation of the method is publicly available on github mind_the_gaps and can be used in any type of time series, not just astronomy.
